This post came from the Aestiva Solutions quarterly newsletter, the Campfire. To subscribe, click here.
With so many challenges facing higher education, it’s more important than ever for libraries to successfully communicate their value to stakeholders. At Aestiva Solutions we focus on communicating library value to stakeholders, whether through ethnographic research, usability testing, or statistical analysis. Library website analytics can provide a wealth of information about your library’s value, but you have to know what to look for and how to configure it. In this Aestiva Campfire we are returning to Summer Analytics. Way back in 2022, we did a Campfire that focused on Springshare LibGuides statistics.

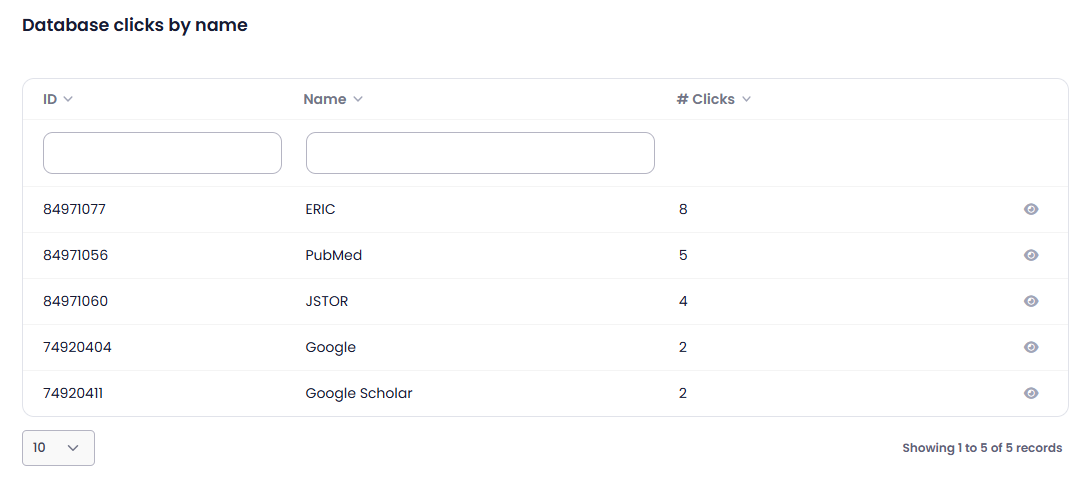
This quarter, we’re looking at another set of data: your library search box and your A-Z database list. Many libraries manage their databases using Springshare’s excellent products. In 2023-2024, Springshare rolled out an upgrade for the standard A-Z databases page. By now, your library has migrated to this new page, but have you taken the opportunity to review your new and improved database statistics? The site shows you the number of clicks for each database, along with a variety of other helpful statistics. While you might have some favorites on the list, if your users aren’t actually clicking on them, then it’s probably time to consider more promotion of the resource or removing it from the list. In our test instance, we’ve got six databases, but one of them has never received any traffic.
The other set of statistics that you might not be tracking are those around the search box you likely have on your library homepage, set to search your discovery layer and/or favorite databases. These statistics are equally as helpful for learning more about your users. For many sites, obtaining access to statistics about your search box will likely require you to set up an external web traffic monitor such as Google Analytics. You can use helpful walkthroughs on the internet such as this one for setting up these types of statistics.
Looking to move beyond mere numbers to communicate library value to your stakeholders? Considering partnering with us! We can look at your current analytic tools and data points and help develop a personalized strategy integrated with statistical analysis and story telling. We can equip you to communicate the most complete and compelling narrative to your institutional leadership, allowing you to lean confidently into telling the library reality you already know. Connect with us today for a free initial consultation.